Since the 1970's, NASA has carried out a series of missions that have focused on monitoring winds over the ocean surface from space. The first attempt occurred when NASA built a "technology demonstration" instrument that flew onboard NASA's Skylab – the United States' first space station – from 1973 to 1979. This successful demonstration showed that remotely sensed measurements of the speed and direction of ocean surface winds was possible using space-based instruments called "scatterometers". In the last decade, NASA has become interested in surface winds from additional technologies, such as polarimetric microwave radiometer observations. These observations passively measure emissions in lieu of the traditional measurement of a radar signal returns.

NASA launched the SeaSat-A Scatterometry System in 1978. It was not until nearly twenty years later that the NASA Scatterometer (NSCAT) would launch onboard the Japanese Advanced Earth Observing Satellite (ADEOS-I). Following the end of the NSCAT mission, NASA built two identical SeaWinds instruments. The first launched in 1999 on NASA's Quick Scatterometer (QuikSCAT) satellite. The second launched onboard the Japanese ADEOS-II satellite in 2002. In 2011, the Aquarius instrument was launched onboard the SAC-D satellite. Built primarily to measure sea surface salinity, its microwave radiometer was able to retrieve wind speed but not direction. In 2014, NASA installed a refurbished spare QuikSCAT instrument to fly on the International Space Station (ISS), called the ISS Rapid Scatterometer (RapidSCAT). In 2015, NASA's Soil Moisture Active Passive (SMAP) mission began retrieving wind speed. Launched in late 2016, the Cyclone Global Navigation Satellite System (CYGNSS) became NASA's first satellite mission to measure surface wind speed in the inner core of tropical cyclones. The Compact Ocean Wind Vector Radiometer (COWVR) instrument was installed on the ISS in 2022, giving a view of the ocean surface at the different times of the day during each orbit.
NASA's Physical Oceanography Distributed Active Archive Center (PO.DAAC) provides ocean winds data from the following missions, instruments and analyses.
ADEOS-II | Cross-Calibrated Multi-Platform (CCMP) | CYGNSS | ISS-RapidScat | NSCAT | QuikSCAT | S-MODE | Salinity and Stratification at the Sea Ice Edge (SASSIE) | Seasat
Remote Sensing Systems (RSS) processes various satellite wind products. The following list includes RSS's wind speed and direction products (based on data from polarimetric radiometer and scatterometers).
WindSat | QuikSCAT | SeaWinds | ASCAT (Metop-A and -B)
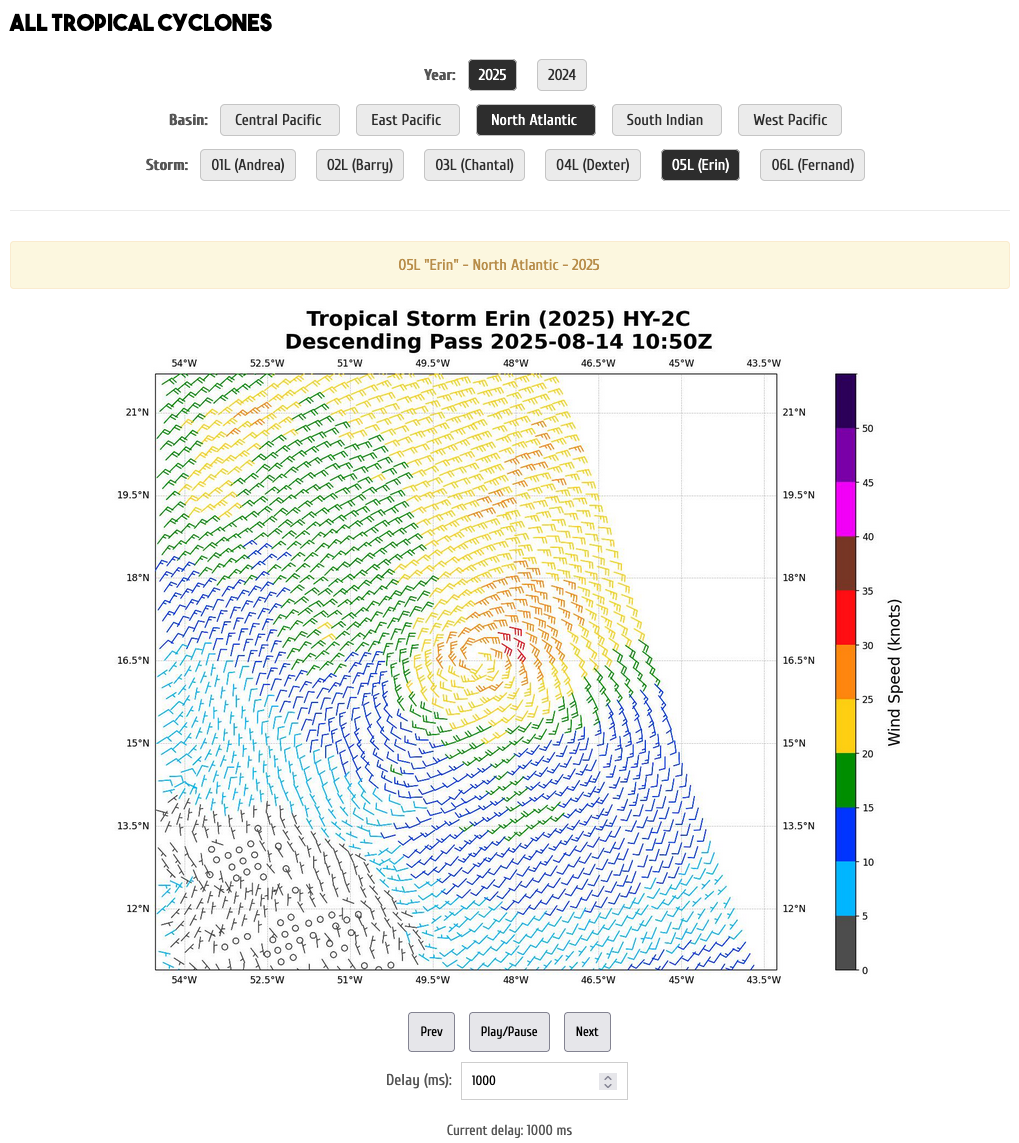
Would you like to track a tropical cyclone across the ocean? You can access wind plots of both active and historic tropical cyclones from the Atlantic, Pacific, and Indian ocean basins in a new web tool from the FSU Marine Data Center!
Using data from 5 wind satellites (ASCAT-B, ASCAT-C, OSCAT-3, HY-2B, and HY-2C) plots are generated of tropical cyclone wind speed over its lifetime in the ocean.
New plots are generated every three to six hours when one or more of the five satellites passes over an active tropical cyclone.
A comprehensive picture of winds over the ocean is stitched together by compiling ascending and descending passes from these 5 satellites. Using this combination of data, we are better able to see tropical storms as they form and move across the ocean. In the animation below, see how much more spatial coverage is achieved by overlapping the ascending and descending passes for just three of these satellites - ASCAT-B, ASCAT-C, OSCAT-3. Data represent September 12, 2025. (Source: NOAA/NESDIS STAR)
Using many different satellites is also important as each has their own strengths. For example, ASCAT uses microwaves with a longer wavelength, which see better through rain than the other instruments currently in use. However, the other satellites have continuous swaths of data (no gap in the middle) so they have greater coverage and are more likely to cover storms.
A comprehensive picture of winds over the ocean is stitched together by compiling ascending and descending passes from these 5 satellites. Using this combination of data, we are better able to see tropical storms as they form and move across the ocean. In the animation below, see how much more spatial coverage is achieved by overlapping the ascending and descending passes for just three of these satellites - ASCAT-B, ASCAT-C, OSCAT-3. Data represent September 12, 2025. (Source: NOAA/NESDIS STAR)
Each plot on the website represents a different satellite’s view of a specific storm. The title of the image tells you which storm, the name of the satellite, whether the portion of the orbit was an ascending or descending pass, and then the date the data were collected. Just like with the map above, not every pass of every satellite will get the full picture, so the full storm is not seen in every image.
To see the all the images through time for a given storm, click the play/pause button.